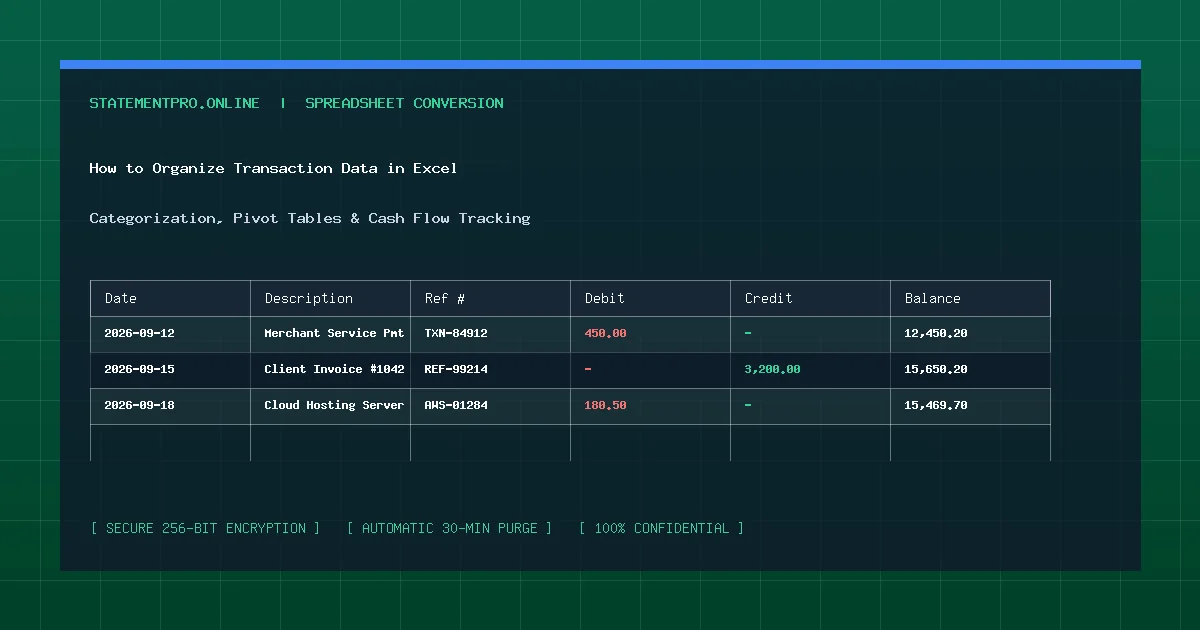
Every month, business owners, independent freelancers, and bookkeepers download dozens of bank and credit card statements. Yet, having hundreds of transaction rows sitting in an unorganized spreadsheet does not provide financial clarity. Without a structured accounting framework, you cannot readily identify high-burn expense categories, project quarterly tax obligations, or evaluate cash flow runway. Learning how to organize transaction data in Excel turns raw transaction exports into an intelligent, dynamic bookkeeping system that saves dozens of hours during tax season.
What Does It Mean to Organize Transaction Data?
Organizing transaction data is the methodical process of structuring, categorizing, standardizing, and summarizing raw financial records into a normalized accounting ledger.
Rather than leaving transactions as isolated strings of text, professional organization applies strict database normalization principles: converting ranges into official Excel Tables (Ctrl + T), standardizing date hierarchies, assigning consistent tax and expense categories, and feeding records into interactive pivot table dashboards.
Why Is Structured Organization Essential?
Adopting a pro-level transaction layout delivers immediate operational benefits for businesses and households alike:
- Instant Tax Deduction Categorization: Map every operational disbursement directly to Schedule C tax buckets (e.g., Advertising, Legal & Professional Fees, Utilities, Travel) in real time.
- Dynamic Cash Flow Forecasting: Group inflows and outflows by week or month to anticipate seasonal liquidity dips before they threaten payroll.
- Vendor Spend Auditing: Quickly aggregate annual spend per supplier to negotiate volume discounts with key vendors.
- Frictionless Accounting Ingestion: Formatted ledgers can be imported directly into QuickBooks Online, Xero, or custom enterprise ERP systems without manual intervention.
The 4 Pillars of Professional Ledger Organization
Follow these four architectural pillars used by certified public accountants (CPAs):
Pillar 1: Flat-File Table Structure (Ctrl + T)
Never leave data as a loose cell grid. Select your transaction range and press Ctrl + T to convert it into an official Excel Table. Excel Tables provide structured references (e.g., [@Debit] instead of D2), automatic formula propagation to new rows, zebra-striping for legibility, and integrated filter dropdowns.
Pillar 2: The Core Column Blueprint
Every commercial transaction ledger should maintain these seven standardized columns:
- Date (Posting Date): Formatted strictly as
YYYY-MM-DD. - Account_Ref: Identifier for the checking, savings, or card account.
- Transaction_Description: The original payee or merchant string.
- Clean_Merchant: Sanitized vendor name (e.g., "Adobe" instead of "ADOBE*SUBSCRIPTION 88910 CA").
- Category: Standardized general ledger account (e.g., "Software & Subscriptions").
- Debit (Outflow): Positive number for expenses and withdrawals.
- Credit (Inflow): Positive number for customer deposits and wire receipts.
Pillar 3: Automated Categorization with XLOOKUP
Manually typing categories for 500 transactions is inefficient. Build a separate reference tab named Categories_Map listing common merchants and their respective categories. Then use dynamic lookup formulas:
=XLOOKUP("*" & Clean_Merchant & "*", Categories_Map[Keyword], Categories_Map[Category], "Uncategorized", 2)
Excel will automatically categorize recurring monthly vendors like utilities, cloud hosting, and office suppliers instantly.
Pillar 4: Dynamic Pivot Table Dashboards
Once your transactions are categorized, highlight the table, navigate to Insert > PivotTable, and create an executive summary:
- Drag Category into the Rows quadrant.
- Drag Debit into the Values quadrant (set to
Sum). - Drag Date into the Columns quadrant (grouped by Month).
You now have a dynamic monthly expense breakdown that updates automatically whenever you paste in new statement data.
Step-by-Step Guide: How to Organize Your Transactions
Follow this straightforward four-step procedure using StatementPro exports:
Step 1: Convert Your Bank Statement
Download your monthly statement PDF and convert it using the StatementPro PDF to Excel Converter. StatementPro isolates transaction rows and splits debits and credits cleanly.
Step 2: Format as an Excel Table
Open the converted workbook in Microsoft Excel, select all cells, and press Ctrl + T. Name the table MasterLedger in the Table Design tab.
Step 3: Apply Expense Categories
Add a new column named Category. Use a dropdown validation list (Data > Data Validation > List) or automated XLOOKUP formulas to assign tax-compliant categories to each row.
Step 4: Build Your Cash Flow Summary
Insert a Pivot Table on a new sheet named Summary_Dashboard. Insert an Excel Slicer for Category and Account_Ref to filter your financial data with one click.
Practical Example: Fictional Commercial Ledger
Consider an organized monthly ledger for a fictional logistics company, Apex Transit LLC:
Organized Transaction Table:
| Date | Merchant | Category | Debit | Credit | Tax_Deductible |
|---|---|---|---|---|---|
| 2026-09-02 | Chevron Fuel Depot | Vehicle Fuel | $185.40 | - | Yes |
| 2026-09-04 | Cascade Logistics Client | Client Revenue | - | $4,500.00 | No |
| 2026-09-05 | Commercial Fleet Insurance | Insurance | $820.00 | - | Yes |
| 2026-09-08 | Apex Industrial Tire Corp | Repairs & Maint | $640.50 | - | Yes |
Pivot Summary by Category:
- Client Revenue: +$4,500.00
- Insurance: -$820.00
- Repairs & Maintenance: -$640.50
- Vehicle Fuel: -$185.40
- Net Monthly Cash Flow: +$2,854.10
Common Mistakes to Avoid When Organizing Data
- Using Multiple Differing Category Names: Using both "Fuel" and "Gasoline", or "Software" and "Subscriptions" fragments your pivot table totals. Stick to a strict, standardized chart of accounts.
- Leaving Blank Cells in Categorized Rows: Uncategorized transactions leave gaps in reports. Always audit blank category cells using Filter > Blanks.
- Hardcoding Summary Totals Inside the Table: Never insert manual "Subtotal" rows directly inside your data table. Let Pivot Tables calculate subtotals dynamically.
Privacy and Data Security Protocols
Organizing commercial bank statements involves sensitive financial figures. Maintain uncompromising security:
- Protect workbook access with strong AES-256 spreadsheet encryption (File > Info > Protect Workbook).
- Ensure conversion tools like StatementPro permanently delete files within 30 minutes of extraction.
- Store archived ledgers in SOC 2-compliant cloud storage with role-based access permissions.
Frequently Asked Questions
How many expense categories should a small business use?
Most small businesses operate efficiently with 15 to 25 primary general ledger categories that align directly with tax return schedules (e.g., Advertising, Insurance, Office Expenses, Professional Fees, Travel, and Utilities).
Can I combine multiple bank accounts into one master Excel sheet?
Yes. Simply add an Account_ID column (e.g., "Chase_Checking_0412" or "Amex_Credit_9921") to distinguish transaction sources while analyzing total enterprise cash flow.
How does StatementPro make organizing transaction data easier?
StatementPro extracts clean, multi-column tables with pre-formatted numeric values and standard headers, allowing you to convert raw statements into official Excel Tables immediately without manual text parsing.
Related StatementPro Tools
- PDF to Excel Converter: Dedicated engine for converting bank and credit card statement PDFs into structured Excel ledgers.
- PDF to CSV Converter: Export clean CSV data feeds ready for automated financial pipelines.
- CSV to Excel Converter: Convert raw CSV text files into styled, audit-ready workbooks.
Related Guides & Tutorials
- How to Clean Data After PDF to Excel Conversion
- How to Remove Duplicate Rows in Excel
- How to Check a Converted Excel File for Errors
- How to Convert a PDF Bank Statement to Excel
Conclusion
Mastering how to organize transaction data in Excel elevates simple bookkeeping into a powerful strategic asset. By applying flat-file table structures, standardized category lookups, and dynamic pivot dashboards, you gain instant financial visibility, simplify tax preparation, and maintain complete control over your business cash flow.